Antero Alku 1.8.2018, English version 15.3.2019.
Executive summary
Key findings
- The cost-effectiveness of different public transport means can be measured by calculating the cost of a place-kilometer.
- Comparable mileage values are obtained by calculating the life cycle cost (LCC) of the system.
- The cost of a place-kilometer must also be calculated for the infrastructure in order to obtain a combined cost of all public transport costs.
- Public transport and passenger cars can be compared by calculating the cost of passenger kilometer for both urban transport and car.
- The production cost of place-kilometer of public transport traffic decreases as the length of the service unit increases.
- The combined production cost of place-kilometer of public transport increases when moving to underground railway solutions.
- Car traffic production costs are higher than public transport production costs for both society and consumers.
- Urban land use solutions and passenger transport are interlinked in that car usage causes urban sprawl, limits land use efficiency, prolongs trips and blocks cost-effective public transport solutions.
- In the Finnish urban structure, the optimum passenger traffic in a city can be achieved using a tramway.
- Using rail traffic it is possible to cover the cost of the combined passenger kilometer cost with ticket revenue.
Article summary
When choosing the right and most cost-effective means of public transport, the costs of different vehicles have to be compared to each other. The best comparator is then the place-kilometer, ie, calculating what is the production cost for a single passenger place to be moved for a one kilometer distance. The place-kilometer can be used for comparison, regardless of whether the operating units are of different sizes or have have a different lifetime. Due to the impact of lifetime, a comparable result can be achieved by calculating the cost of equipment and structures life cycle, ie by calculating the life cycle cost.
The calculation of cost per place-kilometer of traffic is fairly straightforward, but this is also case-specific through the fact that the desired quantitative service level affects the production cost of the operation. This is due to the fact that the required amount of vehicles is determined by the shortest headway offered by the peak hours of travel and the number of vehicle kilometers is determined by the number of services at other times and days of the week, ie the total number of weekly services.
The total cost of public transport service production also includes costs for infrastructure. As with traffic and vehicles, infrastructure has its own maximum capacity. Based on the maximum infrastructure capacity it is possible to calculate the cost of place-kilometer for the infrastructure.
Infra's capacity and hence the place-kilometer cost is influenced by the infrastructure, ie the shape of the track or route street network that must be known for calculating the cost of a place-kilometer. For example, when two-branch traffic links to a common path or track, either branch can not have the same capacity as the common route, but the branches must have the capacity of the common route divided for both branches.
Based on the Finnish examples of Tampere tramway and Matinkylä metro line, it can be seen that in urban rail transport the sum of the production costs of traffic and infrastructure place-kilometers are in the same order of magnitude. In the tramway, the proportion of traffic is higher, while in the metro system the infrastructure share is higher than the cost of the traffic operation. Only the cost of place-kilometer of traffic in bus traffic is higher than the sum of the costs of running the urban rail traffic and infrastructure.
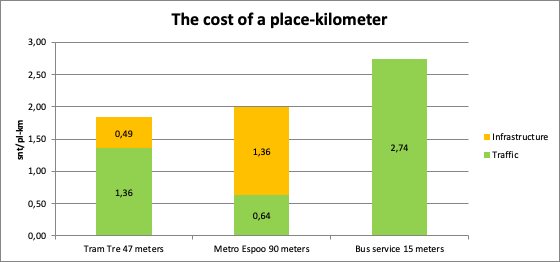
Figure: The total cost of the place-kilometer from traffic and infrastructure on the Tampere tramway with 47 meters platforms, on the Espoo metro line with 90 meters platforms and a 15-meter long bus service on the Tampere tramway route.
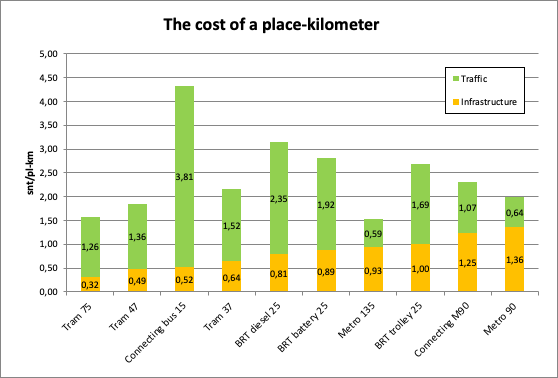
A significant factor affecting the total cost of public transport is the stop distance. However, for the cost order of the bus, the BRT bus system (superbus), the tram and the metro, the key is not stop distance. The order is determined by the length of the unit to be operated. The cost order of the place-kilometer cost does not change on the basis of the stop distance, purchase prices, or even vehicle interior solutions.
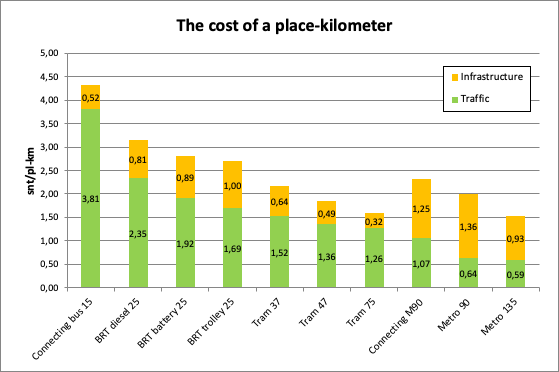
Figure: Calculated place-kilometer costs for different public transport systems. The number after the name of the mode is the length of the traffic unit in meters. Because of a lack of reliable source data, the operating costs of BRT systems are based on double running costs for short 2-axle buses with one driver.
Rail, bus and car transport can be compared with production costs. In that case, assumptions and limitations are to be made regarding the situation being investigated. Passenger places of cars and public transport are, however, not comparable, what for the comparison must be made by comparing the production costs of actual passenger usage, ie passenger kilometers in public transport and person kilometers in car.
In the comparison, it is to be understood that different modes of transport have specific conditions, and therefore the different modes are not always the alternatives of each other. Conversely, this means that choosing a mode of transport imposes restrictions and creates opportunities for the urban structure. The most important thing is that car usage requires a fragmented urban structure where journeys grow long. A dense urban structure with short trips is only possible when based on public transport. The dense structure is the most affordable passenger transport solution for both the city and consumer economy.
At the prevailing cost level, the cost of a car's person kilometer exceeds the cost of the bus passenger kilometer. But car usage also limits the efficiency of land use to about a third of what is the efficiency of land use in Finnish city centers. It is therefore necessary to compare the cost of a journey in a city structure appropriate to each mode of transport.
Using the actual trip lengths of Helsinki city that is based on public transport and car-based suburbs, the cost of a work trip with a car is almost four times the cost of a work trip using a bus and about seven times a work trip cost of the rail bound public transport.
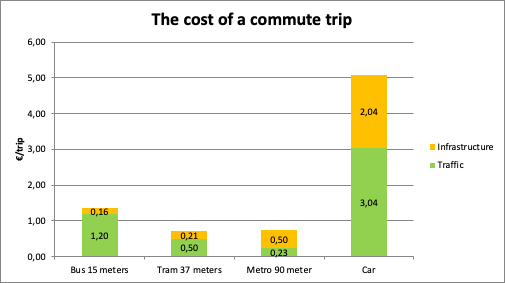
Figure: The cost of a work trip using public transport and a car in the urban structure suitable for public transport and car driving. The source data of this example is the indicated work trip lengths in the city centre of Helsinki and in the suburban area around Helsinki city centre. The cost of a bus trip is based on the bus operating cost in mixed traffic lane with 340 meters stop distance.
The calculations and the results presented here prove that the total cost of the transport system in a city is considerably lower in the city based on public transport than in the city based on car transport. The costs of car traffic paid directly by the consumer alone are higher than all the costs of public transport, ie the cost of the transport and the infrastructure.
In connection with the decision to build a tramway to Tampere, the town's arguments have stated that the tram system is primarily a city development solution. It will make possible the center city of the region to grow with the region's growth. This is an opportunity created by the capacity of a tramway system. At the same time, the tramway system reduces the costs of mobility, thus contributing to the vitality of the area.
Introduction
Over the years, this site has published several articles on public transport costs, their bases and actual unit costs. Over the years, cost data has aged out as the value of money changes and because of the development of technology and system requirements.
The previous article on unit costs has been updated in 2008 when a project plan for Espoo metro line was completed. Later on a subway extension to Matinkylä has been completed, an orbital railway line via Helsinki airport has been built, a project plan for railway loop under Helsinki City, called Pisara, has been finished and contracts for the Tampere tram sysytem has been made.
Planning for transport projects and city planning requires information on public transport costs. Public decision-making needs information on the cost of their decisions, and cost information is needed to compare the options in the transport system evaluation. Comparisons are made between different means of transport and between alternative transport networks.
The cost evaluation of public transport systems has been based in Finland on the practice used in the bus service contracts of Helsinki Region Transport Authority HSL. The corresponding information has been easy to calculate from the statistics for track and subway operations of Helsinki City Transport HKL. Thus, the cost estimates for the public transport operations have been calculated by calculating the number of vehicle days, vehicle kilometers and vehicle hours needed for the operation.
In this procedure, the problem is that bus services are bought out of the free market by companies operating on a business-to-business basis. Urban rail services have been produced by a city-based enterprise without competitors, and there are no investors who need to generate dividends or other revenue.
In order to achieve the comparability of the available data, HKL's own production statistics have been modified for the project studies. The result of the modification is thought to represent urban rail operating costs as operation services were purchased from the open market as is the case with bus operations. The mistake of such a procedure is that the figures used in the calculations no longer correspond to the real cost of the production of rail transport. This is due to the fact that bus and rail transport differ technically and economically so that also the cost structures are different.
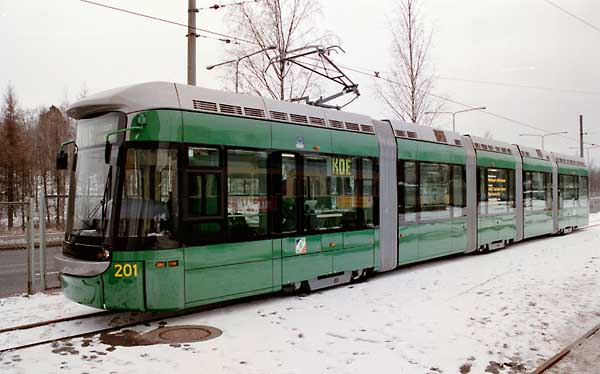
HKL’s first low-floor trams were purchased in the late 1990s. The trams proved to be poorly suited to the geography of Helsinki, and their operation was therefore more expensive than anticipated. The unsuccessful acquisition has increased HKL’s statistical costs, but that does not mean that the new acquisitions would also entail high costs. In 2011, a contract was awarded for trams with a clearly lower cost. HKL’s first Variotram tram at HKL’s Koskela depot in 1998.
Another significant difference is that statistics do not represent the future. Specially in urban rail traffic statistics figure very long history, because the rolling stock and rails systems are very long lasting. However, new vehicles and tracks will not be built the same way as decades earlier. New technology is generally better and less expensive than before. Therefore, the cost of preparing projects should be based on fresh purchases if only information on such is available.
At present (2018) there is a good knowledge of the cost of urban rail transport in Finland. In 2017, contracts have been concluded in Tampere for trams and infrastructure, as well as in long-term maintenance of the fleet. In the Espoo, Matinkylä metro was introduced in late 2017 and the new metro train purchase has been contracted in 2012. Trams will also be delivered to Helsinki on the basis of the 2011 procurement contract.
This article explains the cost of bus and urban rail traffic costs. The cost of infrastructure is a significant part of the real total cost of urban rail traffic and is therefore included in the calculation. For comparability, the transport production of public transport is calculated as the cost of the production unit, place-kilometer. Thus, the number of passenger seats on a single unit for buses, trams and trains does not affect the amount of production cost of the service.
At the level of the transport system it is also important to compare the cost of public transport to car usage. Comparability requires a solution that reconciles the structural differences between a private car use and public transport and also takes into account the impact of different transport systems on the urban structure.
Place-kilometer
Place-kilometer is a way to calculate the cost of the public transport production unit: the cost of offering transport service to one person.
To calculate the cost of place-kilometer avoids the effect of the size and the lifetime of a vehicle unit.
With the the cost of place-kilometer it is possible to compare service production cost of different public transport modes and the share of cost structure and the influence of differet factors to the cost.
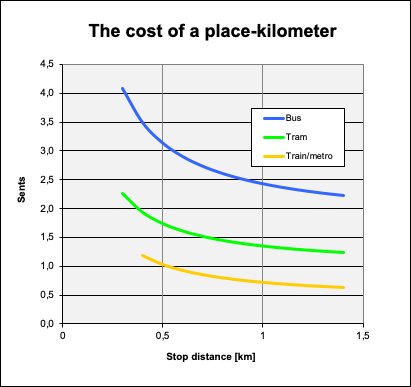
Figure: Influence of the stop distance to cost of place-kilometer.
Evaluating operating cost
In Finland the practice in purchasing bus operation services is to ask the tenderer to specify the pricing in 3 components:
- vehicle rent per operating day
- driver cost per operating hour and
- vehicle cost per driven kilometer.
This makes it possible to adjust the timetables during the contract period.
When purchasing urban rail operation services, the usual situation is that the city owns the rolling stock. The operator does not rent vehicles to the city, but the operator may be responsible for the energy and maintenance, as the cost of both may be a consequence of how the vehicles are operated. In this case the contract may include pricing in 2 components:
- driver cost per operating hour and
- vehicle cost per driven kilometer
Same as for urban rail is usually valid for fully electric buses. Both battery and trolley buses are bound to the local infrastructure. Therefore, the city must carry the risk associated with the vehicle investment by purchasing the vehicles. In limited cases it is possible to sell rail vehicles or trolley buses to other cities.
Battery buses are in early business phase (in 2018), therefore it is not known if battery buses may have real second-hand market.
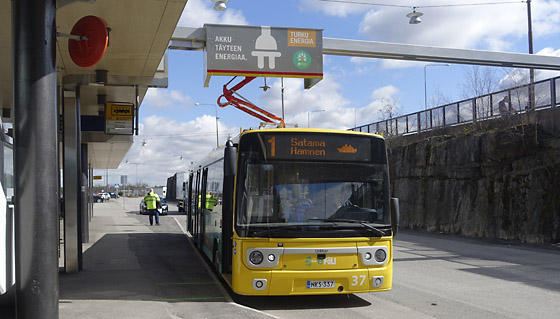
The battery bus runs on public streets like a diesel bus, but the battery bus needs a suitable charging system. For practical reasons, batteries should be charged at least at end stops. So far the charging systems are not standardized and similar everywhere, which ties the battery buses to the lines for which the charging arrangements have been built. Battery bus charging at Turku Airport in 2018.
The following chart explains the comparison of the pricing on a system level.
Table: Expenses caused from the contracting of public transport systems. When contracting diesel bus services, all the service is paid in 3 price components of the contract. Those expenses shaded with gray in the chart column ”Diesel bus” are paid either included in the pricing of the bus service contract or as a part of street maintenance expenses. Also, it is important to understand that for diesel buses the rent is paid only for operating days. With electric buses and rail investment must be paid for each calendar day. So ”Daily price” of a diesel bus is not equivalent to that of electric bus or rail system.
| Diesel bus | Electric bus | Rail | |
|---|---|---|---|
Daily price |
”Vehicle day” = operating day Vehicle rent, insurance, building rental, administration |
Calendar day Vehicle installment, insurance |
Calendar day Vehicle installment, (insurance) |
Hour price |
Driver and foreman salaries | Driver and foreman salaries | Driver and foreman salaries |
Kilometer price |
Maintenance, energy | Maintenance, energy | Maintenance, energy |
Right of way |
(Included in city's street maintenance) | Amortization and maintenance of electric equipment and separate right of way | Amortization and maintenance of track |
Depot and workshop |
(Included in daily price) | Amortization and real estate expenses | Amortization and real estate expenses |
Administration |
(Included in daily price) | Administrative work | Administrative work |
When there is a need to evaluate operating cost, the only valid way to do it is to calculate the Life Cycle Costs. This is because in case of rail or electric bus, renting of vehicles and required facilities like depot and workshop capacity and charging stations is not possible. These costs cannot be targeted to individual vehicle operating days, as that would be a classic mistake of mixing variable and fixed costs.
The above table shows that the costs of the transport system can be divided into two main parts, operating and right of way costs. Each cost component includes both variable and fixed costs, so that the allocation is not based on the changing and fixed costs of system cost allocation. The following chapters refer to the formation of traffic and bus costs.
Operating cost structure
The operating cost of a bus, tram or train is made up of the following components:
- Driver labor cost
- Amortization and financing of the cost of the carriage
- Operating and maintenance costs based on driving time
- Operating and maintenance costs based on the distance travelled
- perating and maintenance costs based on stopping
Operating costs include:
- Energy
- Cleaning and other sanitation
- Consumables and materials such as lubricants, glass cleaners, sand for rail traffic
Maintenance costs include:
- Maintenance and repair operations according to the maintenance program
- Unforeseen repairs, such as breakdowns, vandalism repairs, and accidents
Service and maintenance operations are carried out at a depot. The depot, its equipment, such as machinery, and real estate costs are infrastructure- or right-of-way costs of the system. This is because maintenance and repair facilities cannot actually be acquired and constructed on the basis of the current number of buses or trams.
Although the maintenance services could be purchased as a full service, where the service provider is also responsible for the real estate costs, the liability and the risk of the infrastructure costs are only transferred from the purchaser to the service provider. The service provider is in the same situation as the purchaser, i.e. he has to dimension and acquire the necessary facilities in the same way as the purchaser would have. For example, a space used for a rare major repair needs to be acquired even if the space is often unused.
A situation also arises in small systems where the size and costs of the maintenance organization are larger than needed for the number of jobs involved. This is because even the smallest systems require certain minimum¬ resources, whose minimum capacity is more than, for example, 10 to 15 trams. In maintenance agreements this is reflected in the price of the contract consisting of pricing items based on both calendar time and amount of rolling stock.
Since buses, trams and trains are of different sizes, the cost of operation is not comparable calculated per unit such as bus or tram. The cost calculation can be made comparable by calculating the cost per generated service unit or place-kilometer.
Figure: Place-kilometer cost level in Finland in 2018 by distance between stops for bus, tram and train.
As operating costs contain time-based components, operating costs rise as stop distance is shorter. A shorter stop distance reduces the commercial speed, causing the cost per distance traveled to increase.
It should be understood that the stop distance cannot be indiscriminately increased to reduce operating costs. Increasing the stop distance increases walking distances, which reduces the public transport service level and eventually increases travel time. Determining the optimal value for the total travel time is described in a separate article (currently only in Finnish).
The above figure demonstrates the economic advantage of increasing the transport unit capacity. The train is the largest possible operating unit, which has a cost approximately 1/3 of that of a bus when using the values from the above figure. The reasons for the economic advantage of large sizes are illustrated in the images below.
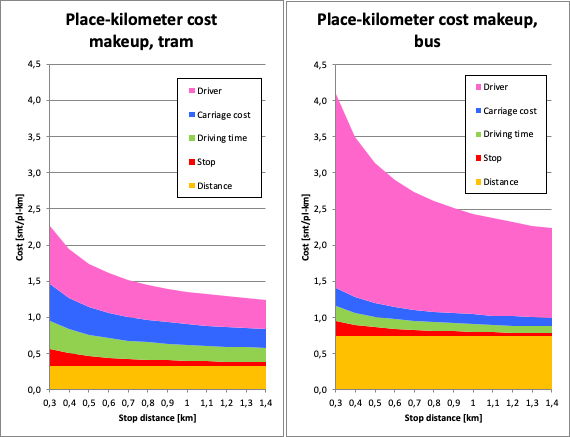
Figures: Tram and bus place-kilometer cost makeup based on stop distance. Tram cost is based on Tampere tram procurement, where tram length is 37 meters. Bus cost is based on 3-axle 15-meter diesel bus service contracts in largest cities in Finland and bus market prices.
The various parts of the operating costs are presented in the above figures for trams and buses. The figures show, that the most significant difference between buses and trams are in the driver costs. The driver cost for buses is equal to the total cost of tram operation. The difference is not caused by salary size, but rather the number of seats the driver’s cost is divided to. The tram in the figure is 37 meters long and it has a passenger capacity of 264. The bus is 15 meters long and it has a passenger capacity of 95.
It is also significant, that the costs due to tram procurement prize and time are almost double those of buses. Tram size and long operational life do not make it a cheaper investment than a bus. On short stop distances even the operating costs are not significantly lower than those of a bus. The reason for this lies in the structure of the maintenance costs. In small systems the fixed maintenance costs are relatively high compared to all maintenance costs. For buses these costs are included in the costs of the distance driven, which is therefore high for buses.
The reason for the large proportion of operating time related operational costs in the figure is that the Tampere railway, which the numbers in the figure are based on, is relatively small compared to larger cities or the total size of bus traffic. The calculation is made for a network of 24.5 km length. For instance, the capacity of the wheel lathe is sufficient for a network 3–4 times as large, or a 75–100 kilometer network. But operations can not proceed without a wheel lathe, and the price of the lathe is not reduced even if the lathe sees very little use.
The counterpart for the high acquisition price of a tram is the quality and safety of the service. Tram price is increased by, for example, the requirements for collision strength and travel comfort.
OIt should be noted, that the low-cost level of trams and other rail traffic is beneficial when the amount of passengers is sufficiently high. The relationship between offered and used place-kilometers, or actual utilisation, is discussed later.
Right-of-way cost structure
The cost of a bus, tram or train right-of-way consists of the following components:
- Construction of streets, tracks, stops and stations
- Construction and equipping of a depot
- Right-of-way operating costs, such as winter maintenance and the cleaning, heating and lighting of stations
- Depot property costs
- Planned maintenance of right-of-way, such as new coating, grinding of rails and maintenance and renewal of traffic control and safety equipment
- Traffic control, insofar it is not included in vehicle operation
For practical reasons, right-of-way costs are well calculated for rail traffic. Right-of-way costs for bus traffic are only calculated in special cases, because buses usually drive on streets, whose acquisition and maintenance is included in the city’s general street maintenance.
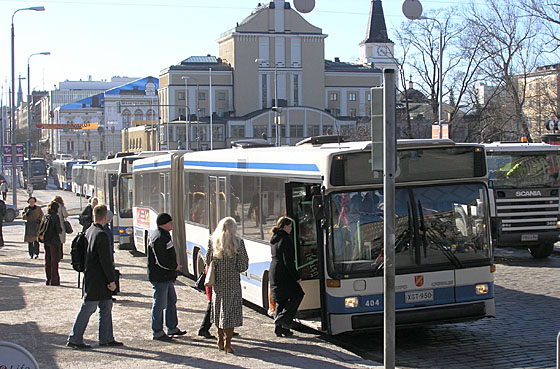
Although calculations usually ignore right-of-way costs, buses actually have significant right-of-way costs. Especially in city centers buses fill one lane per direction. Buses also wear the streets more than other traffic. Line of buses on Hämeenkatu in Tampere in 2004.
On a system level the right-of-way costs of buses still do exist and end up paid by street maintenance. In the dimensioning of street structures, the load from buses and other heavy traffic is the determining factor for structural dimensioning. In addition, street structure dimensioning is based on traffic volume, so the right-of-way cost depends heavily on the planned traffic volume. Especially in winter maintenance bus traffic right-of way are a major cause of costs. The streets for bus routes are included in the highest maintenance class, as otherwise bus traffic wouldn’t operate.
An example of the impact of bus traffic is Kuusmiehentie in Helsinki. The existing street would have had ample space for the buses of line 560. The street structures would not have withstood the additional load from the buses, thus the options were to rebuild the old Kuusmiehentie, including relocation of pipes, or make a separate right-of-way for buses. The right-of-way was the more economical option. The 1.2 km 2-lane bus right-of-way cost 4.5 M€.
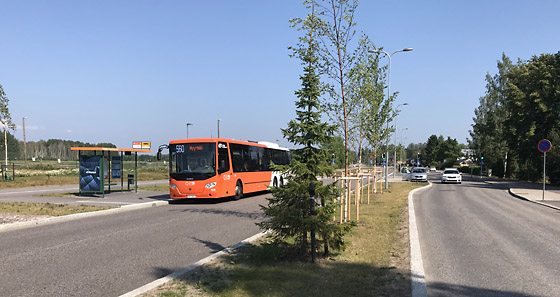
The Kuusmiehentien bus right-of-way in Helsinki was built adjacent to the old street, as the solution was cheaper than moving the pipes and rebuilding the old street to support the load from a busy bus route. The amount of passenger car traffic on Kuusmiehentie would not have prevented the buses from driving on mixed lanes. Bus right-of-way length is 1.2 km and the cost was 4.5 M€. Photo AA 30.7.2018.
Just like comparing different rolling stock, direct comparison of right-of-way costs, by comparing the costs per length or per stop, is misleading. Different types of right-of-way have a different capacity. The maximum capacity is determined by the minimum headway of the stop and the largest possible unit size. An approximate maximum capacity for one lane or track is:
- Bus (2 slot stop) 9.500 persons/h
- Tram (75 m carriage) 21.000 persons/h
- Metro (135 m carriage) 36.000 persons/h
The network structure must be considered when calculating the maximum capacity. The maximum capacity can be attained only in the core parts of the network, as branching reduces the maximum amount of runs in the branches. The sum of the runs of all branches cannot be more than the maximum run amount in the shared section of the network.
For instance, the metro in Helsinki branches at Itäkeskus. On each branch the maximum capacity is only half the maximum capacity of the shared section.
Urban rail traffic right-of-way
The table below contains an example calculation of the capacity and cost of a right-of-way.
The Tram in the table refers to the 2-branch tramway under construction in Tampere (link to Finnish page) which will contain the lines Hervanta–Lielahti and TAYS–Pyynikintori. Both branches can be run with 47-meter trams. There is a purchasing contract for the Tampere tramway, which defines the costs for the project and contains terms which makes it beneficial for the contractor to finish below the agreed cost. Such contracts have yielded favorable results, where the project has been finished ahead of time and at a price lower than in the contract.
The Metro in the table refers to the track between Matinkylä and Ruoholahti on the Helsinki metro (link to Finnish page), which is trafficked on lines extending to Tapiola and Matinkylä by 90 meter trains. The investment is split over a 60-year operation period without interest. The track has been in operation since 2017. The post-calculation and total final cost has not been published by summer 2018. Public information on the total realized cost has been used for this table.
| Infrastructure | Tram | Metro | |
|---|---|---|---|
| Line length | km | 24,5 | 27 |
| Minimum headway | min | 1,5 | 2 |
| Max unit size | person | 345 | 684 |
| Run amount on common part | |||
| Weekday | unit | 614 | 460 |
| Saturday | unit | 431 | 232 |
| Sunday | unit | 344 | 258 |
| Yearly | unit | 199940 | 149812 |
| Carriage output | km/y | 4899804 | 4046328 |
| Seat output | Mp-km/y | 1690 | 2767 |
| Investment | M€ | 285 | 1300 |
| Operational life | y | 60 | 60 |
| Maintenance | M€/y | 3,5 | 15 |
| place-kilometer | snt/s-km | 0,49 | 1,33 |
| Operation | |||
| Stop distance | km | 0,7 | 1,4 |
| place-kilometer | snt/s-km | 1,36 | 0,74 |
| Total | snt/s-km | 1,84 | 2,06 |
The calculation in the previous table indicates that it is possible to reduce traffic costs by investing in an effective right-of-way. The scale factor of a large traffic unit, such as a tram or train, isn’t so large, however, that the right-of-way cost would not matter. The table shows that the place-kilometer costs for operation and right-of-way are in the same magnitude at the maximum capacity of the right-of-way.
Figure: The total place-kilometer cost, consisting of operation and right-of-way costs, on the Tampere tramway, metro in Espoo and operation of a 15-meter bus on the route of the Tampere tramway.
Even if the bus operation network would accrue no right-of-way costs, bus traffic is more expensive compared to the Tampere tramway or the metro in Espoo. Just the operation of a bus costs more than the rail traffic in these examples. In the previous figure the place-kilometer cost for bus traffic at the 0.7 km stop distance of the Tampere tramway is 2.77 c/p-km. In Helsinki bus traffic the mean stop distance is about 0.45 km, for which the place-kilometer cost is 3.3 c/p-km. (See this figure!)
Bus traffic right-of-way
The problem with determining bus traffic right-of-way costs is, that the principle of bus traffic is that it operates on shared lanes in the street network and does not require separate construction unlike rail traffic. As the bus shares street construction and maintenance costs with other street use, this forms a cost benefit for bus traffic compared to rail traffic.
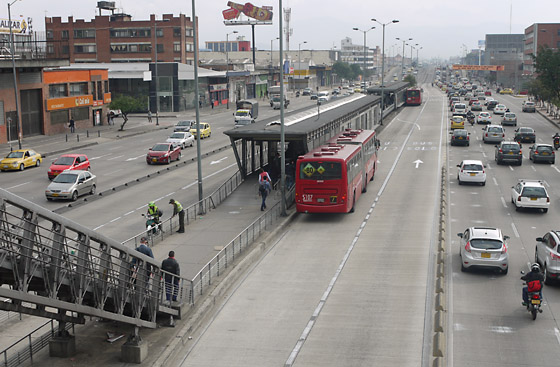
Bus traffic right-of-way costs are easy to determine in BRT-systems, where separate lanes are built for buses. In the picture the BRT-right-of-way has four lanes, so that several buses can use the stops simultaneously, as different lines have separate stop locations. Transmillenio-BRT -system in Bogotá, Columbia, in 2014.
Bus traffic right-of-way costs are easy to determine in effective separated bus systems, such as BRT-systems (superbus systems), where separate right-of-ways are built for buses, similarity to rail traffic. On mixed traffic streets, bus traffic right-of-way costs can be calculated similarly to rail traffic as an additional street maintenance cost caused by the bus traffic. Such additional costs are:
- Space arrangements, such as street width and stop spaces
- Increasing street load bearing
- Increasing street coating load bearing and wear resistance
- Cost for increasing street maintenance class
To compare bus and rail traffic, it is reasonable to compare rail traffic right-of-way and BR right-of-way as well as city center tram lanes and bus lanes.
A 2-lane BRT-street and 2-lane track take up the same amount of space. The practical difference between BRT and track is in surface construction. The BRT-right-of-way is a paved, high load bearing street, which is about 2 meters wider than the track. The corresponding rail right-of-way has two tracks with a gravel support layer, open track, overhead lines and power supply stations. The stops can be similar for BRT and rail traffic, but bus platforms do not have to be as long as trams need.
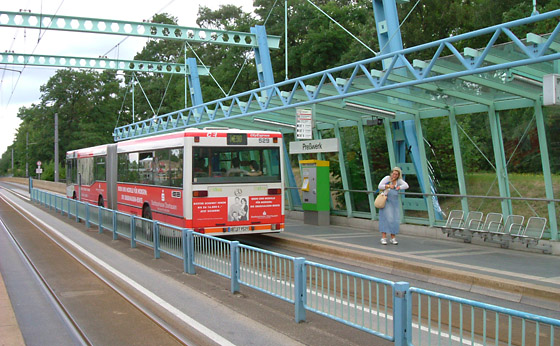
BRT-right-of-way in Oberhausen, Germany, used both with buses and trams. Articulated bus at the Presswerk stop in 2003.
BRT-systems may be based on long superbuses or short fixed-body buses. The buses can be diesel buses, trolley cars or battery buses. Both electricity use causes an increase in bus costs. For trolleybuses, there are overhead lines and feeding stations, while battery buses need charging stations, which long buses also need at intermediate stops. BRT-systems have no obstructions or extra costs for the right-of-way for long articulated buses.
The maximum capacity of the BRT right-of-way is 40 runs per hour, same as for tram, as there is no bypass possibility, which is required for dual length stops. Using 25 meters long articulated buses, these long buses cannot drive to the stop in front of another bus, as the bus must be driven directly to the stop so that all the doors of the bus are next to the platform. In the picture above, the solution in Bogotà is to have two consecutive stops with separate canopy structures to allow the lane-changing bus to straighten before stopping. A 40-run capacity also requires accurate traffic management to prevent bus queuing.
Combined cost
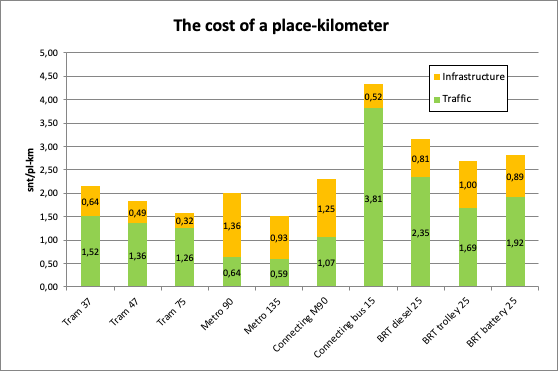
Figure: Calculated place-kilometer costs of different systems. The number after the name of the transport method indicates the length of the operating unit in meters. Due to the lack of reliable data, the operating costs of the BRT systems are based on double the maintenance and operation costs of short 2-axis buses.
been compared in the figure above. Rail traffic information is based on the information from Tampere tramway and metro extension to Matinkylä. The right-of-way- and line networks of BRT-systems (superbus systems) have been set as equal to tramway systems. Tramway and BRT carriage units are thus equal, but operation and right-of-way costs are different.
From the combined place-kilometer costs it can be seen, how increasing unit size improves the economy both for operation and right-of-way costs. A major factor in public transport operation costs is stop distance, but the mutual order between the operating costs for buses, trams and metro trains does not change due to stop distance, procurement price or even due to interior design choices. The order is determined by the length of the operating unit, as the figure below shows.
Figure: Cost of public transport place-kilometer, ordered according to operational costs. The figure shows that the place-kilometer cost of operation diminishes as unit length increases. In ground-level solutions also the combined cost (operation + infrastructure) diminishes as unit length increases. Sensitivity testing shows that stop distance, parking frequency or a realistic variation in procurement prices do not influence the importance of the length of the operating unit.
The relatively large total cost of BRT-systems is due to the limited size of the bus. The driver cost for the 25-meter superbus running on the BRT right-of-way is approximately 45%¬ of the operating costs. The size of the BRT bus (superbus) limits the maximum capacity of the right-of-way to approximately 6000 persons per hour. It is less than 60% of the capacity of a tram right-of-way, when the tram length is 37 meters. The cost of a BRT-right-of-way system is at least about 75 % of the cost of a tram right-of-way. The capacity of the BRT compared is to the tram is reduced more that the total costs are reduced. Due to this the total cost of BRT per place-kilometer is higher than for a tramway.
The above figure shows the major difference between ground-level and underground solutions. In ground-level solutions the infrastructure’s share of the maximum capacity place-kilometer costs is generally 20–30 %, and the combined cost goes down as the unit length increases. In this case a run interval longer than the minimum has a moderate effect on the place-kilometer costs.
In ground-level solutions, the infrastructure’s share of place-kilometer costs are the least. Buses on mixed-traffic lanes and a modern, mainly separately running tramway are in the same magnitude. A separate right-of-way for buses (BRT-right-of-way) has an infrastructure place-kilometer cost closer to underground solutions than ground-level tramways.
Figure: Cost of public transport place-kilometer, ordered according to infrastructure costs. The figure shows that the infrastructure place-kilometer costs increase when moving from ground-level to underground solutions. For ground-level solutions rail traffic have the lowest infrastructure place-kilometer costs. The infrastructure place-kilometer costs for separate right-of-ways for buses are comparable to underground solutions. The number after the solution name indicates the length in meters of the operating unit.
The cost risk of underground solutions is higher than in ground-level solutions. The reason for this is that in underground solutions, the share of the infrastructure is high, above 60%. At this point, both the length of the operational unit and any increase in the run interval from the minimum will have a significant impact on the place-kilometer cost. Also, shortening the stop interval greatly increases the infrastructure place-kilometer costs of underground solutions. The impact of the train length can be seen between the 90 meter and 135 meter metro solutions. Ground-level solutions are flexible and therefore have a much lower financial risk than underground infrastructure.
Although the calculation presented here uses the Espoo metro as an example, the infrastructure cost assessment describes the infrastructure solutions, not the rolling stock used. It is possible to construct ground-level urban railways that provide for trains longer than trams. A raised track built on bridges is more expensive than a ground-level track, which uses level crossings or bridges only for height separation at street crossings. The most essential cost factor in underground construction are the stations. Their costs are tens of millions of euros. The cost of ground-level stations is millions of euros.
In a realistic situation, the entire public transport system cannot be built on rail traffic with an affordable place-kilometer cost. An example of this is column Liityntä M90, based on the Espoo metro. It has been calculated as the sum place-kilometer cost of the metro and its connecting bus system. It has been calculated based on metro track of 13.5 km and 31 km of connecting bus route network.
Utilization
Place-kilometer and passenger-kilometer
The previous chapters lay out how the cost is calculated for a unit of public transport service, the place-kilometer. However, it is not the same as the cost for a unit of consumed public transport service, the passenger-kilometer.
A passenger-kilometer means that a public transport passenger uses a vehicle to travel one kilometer.
If all the seats in public transports were always in use, the number of place-kilometers and passenger-kilometers would be the same. In public transport this is structurally not possible. This is due to the asymmetry of demand in public transport and because the service area contains stops, where lines collect and distribute passengers. For instance, the carriage cannot be filled at the end stop, as the following stops could not be serviced.
Asymmetric means that practical urban structures are often based on suburbs and workplace areas, leading to morning and evening congestion. Carriages traveling against the rush carry a light load, because demand is mainly in the direction of congestion.
The public transport service is asymmetric also in terms of the time of day. The public transport service must also be available at times of low demand. Then the dominant factor is the longest acceptable run interval, even if it results in a higher supply than there is demand.
Utilization
The utilization of public transport is the ratio of the amount of service used and offered, or the ratio of passenger-kilometers to place-kilometers. According to HSL’s information, this ratio in Helsinki, excluding train passenger traffic in the Helsinki area, is 19–21%. Trams have the highest utilization, while metro has the lowest.
In evaluating these figures, it should be understood that the maximum theoretical utilization rate of the asymmetric public transport between suburbs and the city center is 50%. Further, when considering the service area and route length, the maximum theoretical utilization rate in the direction of the congestion is about 63%. Thus, the maximum theoretical utilization rate of public transport between suburbs and the city center is 32%.
In Helsinki, therefore, the impact of daily fluctuations and the matching of demand and capacity is around 33% relative to the theoretical capacity of service production.
A review of the situation in Helsinki also shows that the urban structure has a significant impact on the potential utilization of public transport. In Helsinki the tram serves the old mixed urban structure. Buses and the metro in Helsinki serve a separated suburban structure. There is no significant difference in utilization, but there is a clear difference between transport demand. Buses are used to travel longer distances (4.8 km) than trams (2.2 km) while passenger comfort is lower in buses than in trams. Because of this, seats are more important in buses than in trams.
Tram traffic demand in Helsinki is symmetric, or about as large in both directions. Daily fluctuations are also less in tram traffic than in bus and metro traffic. In a mixed urban structure public transport can achieve a higher utilization than in separated structures.
The reason why there is no significant difference in the utilization rate in Helsinki is in the calculated amount of supply. Trams have few seats relative to the total passenger places, in busses the situation is the opposite. In bus transport, supply is based on the number of seats, and the number of seats is maximized.
The passenger place value for carriages consists of seats and the floor area used for travelling while standing, the numerical value of the utilization rate is determined by how high the density of standing passengers is set. In Europe, a standing density of 4 people per square meter (person/m²) is commonly used. Practical experience has shown that it is the maximum standing density that passengers accept.
Eastern Europe and Asia have used a maximum of 8 person/m². In Sweden and Helsinki, a standing density of 3 persons/m² has sometimes been used. A density of 5 person/m² is often used in dimensioning rolling stock performance.
The table below shows that in the 2006 statistics HKL has used a standing density of 4 person/m² for trams and 5 person/m² for the metro. The standing density for buses averaged 3 persons/m², but since buses of different configurations and lengths are in use, it is impossible to calculate an accurate number based on the published statistics. In the 2011 statistics HSL has used a standing density of 3 person/m², therefore the 2006 and 2011 statistics are not comparable.
| Bus | Tram | Metro | ||
| Carriage kilometers | Mkm/y | 32,9 | 5,39 | 14,63 |
| Passenger-kilometers | Mppkm/y | 419,8 | 117,6 | 696,5 |
| per carriage | person | 12,8 | 21,8 | 27,1 |
| Carriage properties | ||||
| length | m | 13–15 | 20–24,4 | 22,1 |
| seats | units | 37–55 | 40–55 | 65 |
| standing area | m² | 8–10 | 20,2–23,5 | 26,4 |
| place amount 2011 | units | 61 | 104 | 144 |
| place amount 2006 | units | 71 | 123 | 196 |
| Utilization | ||||
| 3 person/m² | 20,9 % | 21,1 % | 18,8 % | |
| 4 person/m² | 18,5 % | 17,6 % | 15,9 % | |
| 5 person/m² | 16,6 % | 15,2 % | 13,8 % | |
| 8 person/m² | 12,6 % | 10,7 % | 9,8 % |
This article has used the common European standing density of 4 person/m² for all modes of public transport. In this way, the results are comparable with the general practices in Europe.
Car traffic cost
It is possible to calculate a service unit cost for passenger car traffic in the same way as for public transport. But due to the private nature of car traffic the concept of a place-kilometer for a passenger car is not congruent to a public transport place-kilometer. Additionally, the service unit for a car compared to public transport is not the distance traveled, but the whole trip.
The results presented here are indicative and mainly reflect the magnitude. They are not based on comprehensive studies and statistics, only on publicly available information.
Different place-kilometers
The reason for the different meanings of the place-kilometer of a car and public transport is that in case of a car the capacity of a car is not adjusted for the demand, instead the number of cars is adjusted for the demand.
The second significant difference between passenger cars and public transport is that passenger cars do not have return runs or any other travel while empty, which is necessary in public transport. A passenger car is used for transportation only. Thus, the place- and passenger-kilometers for passenger cars are the same, since the metric corresponding to public transport place-kilometers is a car-kilometer.
However, in reality passenger cars contain more than one person on average. Thus, not all motoring is just the driver using the car. In Finland there are on average 1.1-1.4 passengers per car in urban area traffic, depending on the purpose of the trip. For example, if every fourth car has one passenger in addition to the driver and all cars drive an equal distance, the car-kilometer performance as person-kilometers (or car passenger-kilometers) is 1.25 pr-km. In the calculations presented here, the person-kilometer effectiveness of commuter car-kilometers is 1.1 pr-km, which is the observed utilization of car commuting in Helsinki [Source: Henkilöliikennetutkimus 2016].
Instead of passenger- and person-kilometer costs public transport and passenger cars should be compared based on the cost of the trip. This is due to differences in routes traveled and the effect these modes of transport have on urban traffic. In public transport you must travel along the existing route network, while a car drives an individual route along the available road network. Therefore, related to the geographic distance, public transport trips are usually longer than car trips. But in an urban structure based on public transport, the geographic distance is shorter, as motoring limits the effectiveness of land usage and decentralizes the urban structure.
Passenger car use cost
A passenger car use cost comparative to public transport is calculated similarly to bus traffic. However, a passenger car does not have driver costs. Passenger car maintenance costs include the infrastructure costs of service and repair facilities, as maintenance is purchased as a service, where the price includes facility costs.
Passenger car operating costs are calculated here based on actual use needs. These costs are based on the price of a car enough for commuting and transaction needs. Here enough is defined as the most sold type of passenger car, which in Finland is the medium-sized family car such as Skoda Octavia, Volkswagen Golf or Toyota Auris. In this case the price of exceptionally expensive cars is assumed the be a cost for needs other than movement.
In the table below, the VAT-included cost of one kilometer is 31 cents, based on the life cycle of a car. In the year 2018 the Finnish state uses 42 cents as the cost of work-related travel, which is a higher use cost than what is calculated here.
Table: Example of operating costs over a passenger car’s life cycle. Car usage and use duration based on Finnish personal traffic research. Maintenance means planned maintenance according to the maintenance schedule. Unexpected repairs are repairs not included in the maintenance plan, such as wheels, replacement of worn parts and fixing faults in the car. Car insurance does not include VAT. VAT must be excluded for the total sum to be comparable to public transport costs, which are calculated without VAT. The calculation does not include interest.
| unit | life cycle | per kilometer | |
| Operating lifetime | y | 19 | |
| Kilometers per year | km | 18.000 | |
| Procurement | € | 25.000 | 0,058 |
| Maintenance | € | 8.200 | 0,024 |
| Fuel | € | 33.500 | 0,098 |
| Insurance and tax | € | 12.400 | 0,036 |
| Unexpected repairs | € | 21.000 | 0,063 |
| Parking | € | 5.700 | 0,017 |
| Total | € | 105.800 | 0,311 |
| Total, VAT 0 % | € | 87.700 | 0,250 |
Passenger car infrastructure cost
The infrastructure costs of passenger cars are formed differently from public transport, as the cars can use the entire road network, not just certain route streets. The infrastructure costs of passenger cars consist of the following parts:
- Parking space next to apartment (one per car)
- Parking space next to workspace (one per car)
- Parking space at service and transaction sites (shared between multiple cars)
- Street areas and other traffic areas required by passenger cars
Like in public transport, the infrastructure cost per car is based on the capacity of the way. The unit for motoring way capacity is one lane. In public transport, the capacity of a lane or track is determined by the dimensioning of the stop. In motoring the capacity of a lane is determined by intersection crossing capacity. In an urban environment the capacity of a lane is the crossing capacity of a signal-controlled intersection.
The capacity of a uniformly driven lane is larger than for a lane where traffic is interrupted by the traffic lights in an intersection. If space allows, the intersection can be made an interchange, in which case the intersection does not hamper traffic moving straight. A less space-intensive solution is to build a signal-controlled intersection, where one lane is divided into multiple turn lanes where the combined capacity of the lanes is equal to one continuous lane. These solutions are usually possible only in suburbs, outside the urban grid layout.
Approximate capacities for one motoring lane are:
- Signal-controlled intersection 1200 cars / hour
- Continuous lane 1800 cars / hour
It is not easy to define motoring infrastructure costs, as the infrastructure can be built in multiple ways depending on the nature and effectiveness of land usage. For example, parking can be an open field, but in dense urban structures the move is towards parking garages or underground parking.
The lanes required by motoring are partially a valuation question. Broad streets have been made before motoring for aesthetic purposes. The current practice is separation of traffic modes, where separate lanes are built for cars, bicycles and pedestrians. Thus, the street used by motoring is not only a lane and the adjacent sidewalk. For instance, nowadays streets contain planted green belts separating sidewalks, motoring lanes and bicycle lanes.
The detailed structure of a street is presented in a street plan, which presents, in addition to motoring lanes, all other areas meant for moving and the areas between them, which usually are planted green belts. The cost of the structures included in the street plan are street traffic lane costs
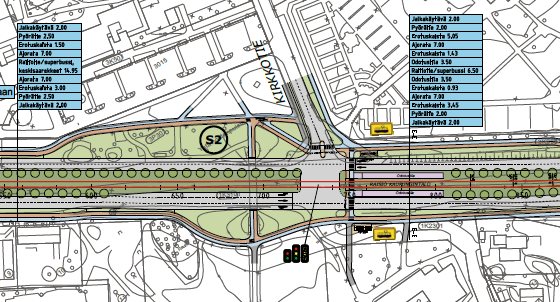
An example of a street area plan for the Turku tramway. The lane reserved for cars is indicated by grey in the picture. Brown indicates bicycle lanes and blue indicates pedestrians. The entire colored area is street area, including planted plants, grass and trees. Picture from the detailed general plan of the Turku tramway in 2018.
The length and total area of the street network required by motoring depends on the placement solutions in the city plan as well as the lengths of the car trips. The calculations in this article are based on current Finnish zoning practices, the technical properties of road traffic and statistical values from the Helsinki area.
The lane costs associated with passenger car use have been calculated using the alternative principle. This means that the street and traffic area structures required by motoring are compared to the situation where no structures are required just for motoring. For example, the freeways and ring roads in the Helsinki area would not be needed in their current extent, if all motorists used public transport. The separation of motoring, cycling and walking on their own lanes and the resulting need to build separate lanes is also due to the safety and comfort detriments caused by motoring.
According to the alternative principle, streets that adjoin properties must be built regardless of passenger car use, as maintenance and rescue traffic must have access to the property. Motoring costs include those street structures and areas that must be built because the number and speed of cars exceed the capacity and properties offered by the adjoining and connecting streets.
The determining amount for motoring is the amount of commuting. In a similar way the capacity of public transport is determined by commuting. As the intent is to compare motoring and public transport infrastructure costs at the optimum usage of the infrastructure, the basis for motoring cost calculation is, that everyone who can use a car will do so. To maximize land usage effectiveness, resident parking is arranged in building basements.
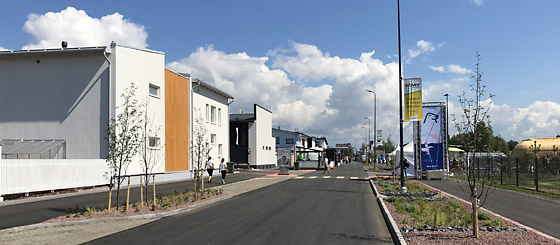
Modern street cutaway from the housing fair in Pori 2018. Between the roadway and the light traffic lane is a green belt with trees. Everything outside the building walls is street area. AA 5.7.2018.
According to land usage statistics, the suburbs in Helsinki have 1.4 times the street area compared to housing floor area. When comparing street areas in the inner city and suburbs of Helsinki to the floor areas of all buildings, we can see that 37% of the street area in the suburbs is built regardless of motoring. This result assumes that the street area in the inner city, which has been built before motoring, compared to the building floor area indicates the street area that is necessary regardless of motoring.
It can be proven mathematically, that the observations about land usage in Helsinki are caused by motoring. By designing a general plan for a suburb based solely on motoring, it can be seen that the required street area is 1.6 times the housing floor area. The statistical value for Helsinki is 1.4. The difference is because the suburbs of Helsinki are not designed based on total motoring, but public transport is also made available and is being used.
In a theoretical suburb 37% of the street area is built regardless of the amount of motoring. The statistical value for Helsinki is the same. The reason is that in the city center there are only streets, which in modern suburban planning are called plot and collecting streets. These streets are needed for access and maintenance traffic, and their dimensioning is not based on the street capacity needs of car traffic. Interconnecting main streets, such as freeways with their interchanges, do not exist in the city center. In the suburbs they exist solely due to the amount of motoring.
The street area costs caused solely by motoring are calculated based on the existing and planned highway projects in the Helsinki area. Such highways are like Kehä I or Kehä II, which only serve movement between the areas containing plot streets. The main roads inside suburbs, such as the ring roads and radial freeways around Helsinki, have at least four lanes and contain frequent interchanges. This makes them expensive compared to roads between cities.
The passenger car trips and capacity need of motoring has been calculated based on trip information from the Helsinki area Personal traffic study of 2016, by assuming that all trips made with a car or public transport would be made with a passenger car.
Both the calculation and the statistics from Helsinki are only applicable for Finnish practices of urban and suburban development. A traffic system based on motoring and the suburban development practices also limit land usage effectiveness, since as population density increases, the land area needed by motoring increases faster than the land area needed by housing and other functions.
The calculation does not include parks and unbuilt areas. In Helsinki these areas account for 55% of the land area, not including the Östersundom area. Unbuilt areas increase trip lengths, as distances become greater. The statistics of Helsinki do not reflect an urban structure based solely on motoring, as public transport is available everywhere. This reduces the street area in the suburbs of Helsinki compared to suburbs based solely on motoring, as public transport reduces the amount of motoring.
Transport system cost
Combined mileage cost
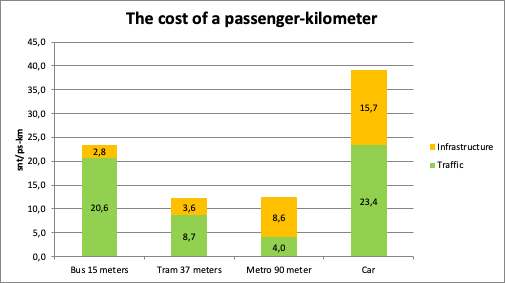
In order to compare motoring and public transport, the utilized service production should be compared. Thus, the personkilometer cost of motoring must be compared public transport passenger-kilometer cost at the actual utilization of public transport. As has been explained earlier, in this article the public transport passenger-kilometer cost calculation has been made using the standing area density of 4 person/m², and the various public transport systems have all been calculated with the same density.
Figure: Passenger-kilometer cost for different public transport modes and a passenger car, based on actual utilization. Bus cost has been calculated in suburban street traffic on mixed lanes. Tram costs have been calculated based on the Tampere tramway, with utilization from the Helsinki statistics. Metro costs are calculated based on the metro to Matinkylä. Passenger car costs has been calculated by including motoring infrastructure costs from street areas, which would not be needed without motoring.
Trip cost
The numbers in the figure above only compare the public transport passenger-kilometer cost to the personkilometer cost of motoring. The numbers do not consider that passenger cars and public transport move by different routes and in a traffic system based on motoring, travel lengths increase, as land usage cannot be as effective as in a public transport system.
For example, the average length of commuting in Helsinki is less than half of the length of the commute in a motoring-based suburb. But the motoring capacity of the public transport -based street network in central Helsinki is only about a third of the demand for passenger transport resulting from the built floorspace, i.e. land usage effectiveness. Thus at least 2/3 of the personnel traffic in the center of Helsinki must be with public transport.
The traffic systems in the center of Helsinki other Finnish cities can therefore not be based solely on motoring. Due to this the cost for urban traveling trips cannot be realized in the same ratio as the ratio between the personkilometer cost of motoring and the public transport passenger-kilometer cost to.
Table: Length of commute and shopping trips in the capitol area on various urban structure zones. [Source: Ristimäki ym. (2011): Yhdyskuntarakenteen vyöhykkeet.]
| Inner city | Public transport zone | Motoring zone | Other zone | |
|---|---|---|---|---|
| Commute | 5,8 km | 12 km | 13 km | 26 km |
| Shopping | 1,2 km | 3,2 km | 4,3 km | 9,2 km |
When the cost comparison between motoring and public transport cannot be made just by comparing kilometer costs, trip costs must be compared in such urban structure, where travel can be based solely on motoring or solely on public transport. This also means that a motoring city has an upper limit for land usage effectiveness and a public transport city has a lower limit.
In the figure below the cost of a commute has been presented for various mass transit systems in a public transport -based urban structure and with a car in a motoring-based urban structure. The length of the commute is 5.8 km with public transport and 13 km by car, which are the actual lengths in Helsinki. The cost per kilometer are as shown in the previous graph.
Figure: The cost of a commute with mass transit systems in a public transport -based urban structure and with a car in a motoring-based urban structure. Personkilometer costs are the same as in the figure above. The length of the commute is 5.8 km in the public transport city and 13 km in the motoring city.
This figure shows that motoring is expensive in a city. In a motoring-based urban structure 2.04€ of the cost of a commute by car are infrastructure costs, when in a public transport -based structure the infrastructure costs for a bus and tram are 0.16 and 0.21 €.
Although the costs of rail transport are the lowest, it must be understood that the low costs are based on high capacity and high utilization of that capacity. High capacity utilization requires that the urban structure and land use be more efficient by the same factor that the metro is more efficient compared to the tram and the tram is more efficient compared to the bus.
The figure below shows the contribution of the user and society to the costs of public transport and motoring. The cost of the user for public transport is calculated from the Helsinki 30-day ticket, used for commuting and 6 other trips a week. The motorist will pay for all car expenses as well as residential parking costs. Of the costs paid by the motorist, the sales tax-free cost of the fuel is 1.03€, which is more than the price of the public transport ticket.
Figure: The shares of the user and society to commuting costs in public transport- and motoring cities. The cost of one trip with public transport is calculated from the Helsinki 30-day ticket, used for 10 commutes and 6 other trips per week. The motorist pays for all car expenses as well as residential parking costs. The fuel’s share of the motorist’s costs is 1.03€. All costs in the figure are without sales tax.
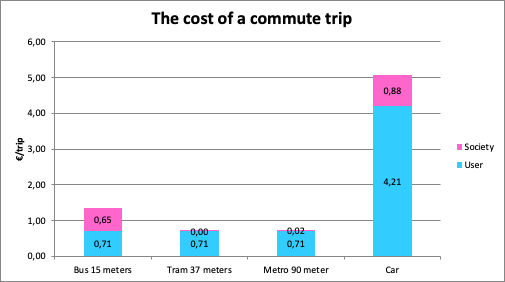
With the initial values used here, bus traffic requires a 47% public subvention, which equals 0.65 € per commute. Motoring cost for the society, i.e. the 0.88 € subvention per commute is still higher than the bus traffic subvention. Rail traffic costs are equal to the calculated ticket cost per trip. The figure also indicates that when serving a motoring-suitable distributed suburban structure, rail traffic also needs subvention, as the trips are longer, but the ticket price is the same as in the urban area.
For the city, motoring causes costs not only for the street network and the street maintenance, but also other utilities costs, which are more expensive per capita in a fragmented urban structure than in a dense public transport city.
In addition to operating and infrastructure costs, the transport system also has external costs, which are costs for accidents and environmental damage. Part of the cost for accidents is included in the operating costs as insurance. As the Finnish healthcare system is based on public funding, insurances cover only the charges payable by the consumer in accordance with set tariffs, not the actual treatment costs of the accident victims.
Motoring is also expensive for the consumer. Ultimately, the consumer pays the city's expenses in municipal tax, but the car's operating and purchasing costs as well as tenant parking is paid directly by the consumer. Costs directly paid by the motorist are higher than all expenses of the public transport in a public transport city.
In the project evaluation guidelines used in Finland, a key factor has been the time spent by the motorist and passenger. The time has been given a monetary value, and any shortening in travel duration has been considered a monetary benefit for the project. Using these evaluation guidelines, a cost should be assessed for the driver of the car similarly as for a driver in public transport and added to the motoring cost. This is also supported by the fact that a public transport passenger can work or read during the trip, while the driver of a car must concentrate on driving. According to the current guideline the value of the driver’s time for the commute is 3.20€. It is more than half of the value of the commute by car. The value of the time for the car is 0.25 € per personkilometer.
Data sources and reliability of the result
The results presented in this article must not be considered as generic and unconditional, instead they are examples based on the cases used. As is explained, the sample cases have their individual volumes. In real own case similar results must be calculated based on the data of the case in question.
It is also important to understand that different modes of public transport and motoring are alternatives to each other only in limited circumstances. In very sprawled urban structure motoring is the only meaningful option. But on the other hand, the traditional block based European town centre structure is too dense for traffic being managed only with motoring, when the city area is too large for only walking.
Similarly, different modes of public transport are not alternatives for each other. As an example, in City of Tampere in Finland, the capacity of a bus system was not enough for the growth of the public transport in the city centre. Before the decision of 2016 to build a tramway, a subway system was in plan and the master plan of Hervanta suburb from 1970's was based on a metro like rail system. In 2000's the subway was understood too expensive.
The source data for this article is the latest data of public transport, motoring and urban planning available in Finland. Total number of individual source values is app. 150. They are from rolling stock and infrastructure procurement, operating, demographic statistics and values used in urban planning dimensioning.
The result values cannot be more reliable than source values. But all the source values do not have equal importance. And over all, passenger transport is human behavior, which is not precise and repetable operation of a machine.
Mobility surveys produce numerical values of how people have behaved in the circumstances and moments of the survey. That does not prove same people behave exactly same way in some future. Especially if the urban structure and the available mobility services are different than at the time of the survey. This means that the results in one city and one moment cannot be applied as such in another city and time.
An important factor affecting operating cost is stop distance. In chapter Combined cost can be seen, how unit costs decrease when the operating unit length increases (picture below). The unit cost results are calculated using stop distances typical for each transport modes. To validate the results, a sensitivity analysis was made. It showed that the variation of stop distances does not alter the order of the mode unit costs. So the dominating feature is the operating unit length, though the differences may increase or decrease.
Figure: Cost of public transport place-kilometer, ordered according to operational costs. The figure shows that the place-kilometer cost of operation diminishes as unit length increases. In ground-level solutions also the combined cost (operation + infrastructure) diminishes as unit length increases. Sensitivity testing shows that stop distance, stopping frequency or a realistic variation in procurement prices do not influence the importance of the length of the operating unit.
In the numbers of the picture above, the initial values for stop distances were:
- 340 meters for connecting (feeder) bus line
- 700 meters for trams and BRT buses
- 1400 meters for metro
The sensitivity analysis was done setting the stop distance same for all modes using all three values, 340, 700 and 1400 meters.
Chapter Operating cost structure showed that the labor cost of the driver is significant. However, this does not mean that the driver salary would set the differences between modes. Basically all expences are based on labor value. Therefore drivers salary cannot differ from the general salary level and the ratio between drivers salary and other costs do not vary. As a sensitivity analysis, the result was tested by splitting half of the driver salary away. Still the unit length set the cost order of the modes.
Results were also validated to the statistics of Helsinki Region Transport Authority (HRT). In HRT annual report of 2017 tram passenger-kilometer is reported to be 27 snt/ps-km. Instead of values based on Tampere tram, the calculation was made with the source values of Helsinki tram network and operation. The result was 27 snt/ps-km as in the statistics on HRT. The results for buses and metro are already practically equal to HRT statistics, so for them there were no need to any sensitivity analysis to explain differences.
The reason for the difference with the tram is in three big differences in the system features between Helsinki and Tampere. Tram length in Helsinki is 21–24 meters, in Tampere it is 37 meters and extendable to 47 meters. In Helsinki 27 meter trams were delivered only from year 2017. Average stop distance in Helsinki is 350 meters instead of 700 meters in Tampere. Third difference is commercial speed. Stopping factor in Helsinki is 1,5 when in Tampere a value 1,1 is used together with many track sections for higher speeds than in Helsinki. Tampere is going to have a modern traffic priority system not available in Helsinki.
There is known unreliability for the costs of BRT systems. Except for purchase price and driver cost, a double articulated bus is calculated as two 2-axle buses. This is because 25 meter double articulated buses are very rare in Europe. Some existing implementations are very new and no experience exist yet. The reported purchase prices for double articulated buses are 1,5–2 times the price of two 2-axle buses. The maintenance cost of two 2-axle buses is propably less than maintenance of double articulated bus.Therefore the costs of BRT is presumably underestimated in this article.
The smallest difference between two modes is 10 % between 37 meter tram and 25 meter BRT trolley bus. So for the mode order to change, the cost structure should vary at least 10 %. Taken into accound the unreliability of BRT costs and referring to the BRT cost values used in tram and BRT comparison in City of Turku, more realistic difference is 13–14 % which still were the smallest difference between modes.
To compare the costs of motoring and public transport, the cost difference is structural, not due to price level. Only the cost of motoring and buses are near enough each other so, that the variation in market price levels or the effectivness of the operation may have an impact for which has a higher cost. The passenger-kilometer cost of only operating a bus is app. 14 % less than person kilometer cost in a car. A car becomes less expensive than a bus if the utilization value of a car exceeds the value 1,25 persons in a car. On the other hand, if the annual usage of a car is reduced to the average level of car usage in Helsinki, the benefit of the increased utilization is lost.
Although the operating cost of a car and a bus are near each other, there is no way to offset the difference in the infrastructure cost per person-kilometer and passenger-kilometer.
Urban structure has a very significant impact. The impact of the car-based urban structure can be seen in the statistical values of city of Helsinki. The fact that the cause of the discrepancy is due to motoring was proved by calculating the cost of the extra infrastructure required to make motoring possible. The calculation was made using an example of a city plan based on the current planning practices. The example and the statistical values match each other even amazingly well.
Definitions
BRT (Bus Rapid Transit) is a high speed public transport system built using buses as vehicles. In USA BRT may mean reserved bus lanes in highways. In South America, like in Brazil and Columbia, BRT systems are built like urban rail systems using high platforms offering stepless entry in buses.
Bus right-of-way is a road or street section built and reserved only for buses. In some cases other limited traffic may be allowed, but not private cars.
Commercial speed is the public transport vehicle average speed including the time of stopping at stops, crossings, traffic lights and traffic jams. Commercial speed is not same as allowed or top speed, which are allways higher than commercial speed.
Life cycle cost (LCC) is the total cost of using a system or a unit during it's life time from production to scrapping. LCC includes any possible cost related to the use of the item. Therfoere LCC includes f.ex: manufacturing or purchase, service, maintenance, energy, operating, unexpected repair and scrapping or recycling of the item. See a sample of Life Cycle Cost.
Mixed urban structure is urban structure, where housing, shops, offices, industry, admninistration, services, leisure etc. urban activities and urban life modes are mixed in walking distance.
Monetary value of time is fundamental part of road project evaluation structure. It is originally calculated as salary value of work time. Today it is understood, that if the travel time decreases for what ever reason, the time no more used for travelling is not wanted or not possible to use for working and earning more. The statistics show, that if travel time may shorten by increased travelling speed, people do not shorten the time they use for travelling, instead they lengthen the travelling distance so that the travel time remains constant. Which in practice means, that there does not exist any decrease in travel time when increasing the speed of travelling. And therefore, there does not exist any monetary value for time and such values should not be considered as benefit for any road project.
Passenger-kilometer is a traffic production unit to have moved a passenger for a one kilometer distance.
Place-kilometer is a traffic production unit to offer a travelling place for a passenger for a one kilometer distance.
Person kilometer in a car corresponds to the passenger kilometer of public transport. For a car, it is more meaningful to use a person than a passenger to distinguish between a car driver and a passenger.
Separated urban structure is urban structure, where urban area is divided to dedicated regions for different urban activities, like housing areas, industry areas, business areas, shopping areas etc. In separated urban structure different activities cannot be accessed by walking.
Shared lane is road or street lane for all kind of road transport. Shared lanes should be avoided for public transport use if the car transport volume is high enough to cause dealy for public transport vehicles.
Stopping factor is an indicator for the efficiency of public transport operation. It indicates how many times a vehicle must stop during it's trip related to number of stops at the route. For full priorities and no stops the value is 1, if vehicles stop at all stops. A common practice with buses is that they stop at the stops only by request. Therefore stopping factor may be less than one for a bus route.
Superbus is a Finnish and Swedish nomination for large-sized double-articulated buses. Bus systems using such buses are called BRTs (Bus Rapid Transit).
Travel time is time between departure at the start point door and arrival at the destination door. Parts of the travel time are walking, waiting, time spend in the vehicle and time spend in transfers.
Vehicle day is a service production unit used when procuring bus transport services. In principe, vehicle day is one day rent for a bus. Though the procurement period is for years, vehicle days are only calculated to be invoiced for the days the bus is in service. Therefore vehicle day is not equal to investment cost of the bus.
YHTALI is an acronym for the project evaluation guidelines set by ministry of transport and used in Finland for evaluating traffic infrastructure projects. The guidelines are originally stated for evaluating road projects where there is no real money incomes to cover the expenses of the road building. To prove the projects to be benefical, the benefit of the project was increased speed. The speed increase was used to calculate the decrease in travel time. The travel time decrease was then converted to money based on Beckers theory published in 1965. In Beckers theory decrease of travel time will be used to increase work time and that way increase incomes. Currently decrease of travel time, called time saving, is not calculated as work time and given salary value, but a fraction of salary. And other external impacts like environmental impacts are also calculated. But still, the time value in money value is strongly dominant benefit and practically the value which sets the benefit cost ratio.
Sources
Jalkanen, Riitta; Kajaste, Tapani; Kauppinen, Timo; Pakkala, Pekka; Rosengren, Camilla (1997): Asuinaluesuunnittelu. Rakennustieto Oy, Helsinki. ISBN 951-682-438-2.
Riikonen, Jarmo (2007): Joukkoliikenteen yksikkökustannukset 2006. HKL Suunnitteluyksikkö D: 5/2007.
Joukkoliikenteen yksikkökustannukset 2011. Helsingin seudun liikenne 16-2012. joukkoliikenteen_yksikkokustannukset_2011.pdf
Ristimäki, Mika; Kalenoja, Hanna; Tiitu, Maija (2011): Yhdyskuntarakenteen vyöhykkeet. Vyöhykkeiden kriteerit, alueprofiilit ja liikkumistottumukset. Liikenne- ja viestintäministeriön julkaisuja 15/2011. ISBN (verkkojulkaisu) 978-952-243-227-8.
Tampereen kaupunkiseudun lähijunaliikenteen kehittämisselvitys. Loppuraportti. Tampereen kaupunkiseutu 2012.
Tampereen kaupunkiseudun ja valtion välinen maankäytön, asumisen ja liikenteen aiesopimus 2013–2015 (MAL-aiesopimus) 7.2.2013
Tampereen raitiotie, yleissuunnitelma. 24.5.2014
Valtion ja Tampereen kaupunkiseudun kuntien välinen maankäytön, asumisen ja liikenteen sopimus 2016–2019 (MAL-sopimus) 9.6.2016
Tampereen raitiovaunujen hankinta-asiakirjat. Tampere 2016.
Tampereen raitiotien toteutussuunnitelma. Suunnitelmaselostus osalle 1: Hervanta–keskusta–Tays. Tampere 2016. Raitiotieallianssi_toteutussuunnitelma_osa1_20160905.pdf
Helsinki alueittain 2016. Avoin data www.avoindata.fi. Helsinki 2017. Helsinki_alueittain_2016.xlsx
Henkilöliikennetutkimus 2016. Liikennevirasto 2018. https://www.liikennevirasto.fi/tilastot/henkiloliikennetutkimus
HSL vuosikertomus 2017. Helsingin seudun liikenne -kuntayhtymä 2018. https://vuosikertomus.hsl.fi/
HSL tilinpäätös 2017. Helsingin seudun liikenne -kuntayhtymä 2018.
HSL Tilinpäätös 2017.pdf
Turun raitiotien yleissuunnitelman tarkennuksen kuntataloudelliset vaikutukset 5.1.2018. Turun kaupunki 2018. raitiotien_kuntataloudelliset_vaikutukset.pdf
Turun raitiotien yleissuunnitelman tarkennus, liitteet. Turku 2018. raitiotien_yleissuunnitelman_tarkennus_paaraportti_liitteet.pdf
Page created 1.8.2018. Last modified 3.6.2019 / AA